Delaware • New Jersey • Pennsylvania
New York • United States of America
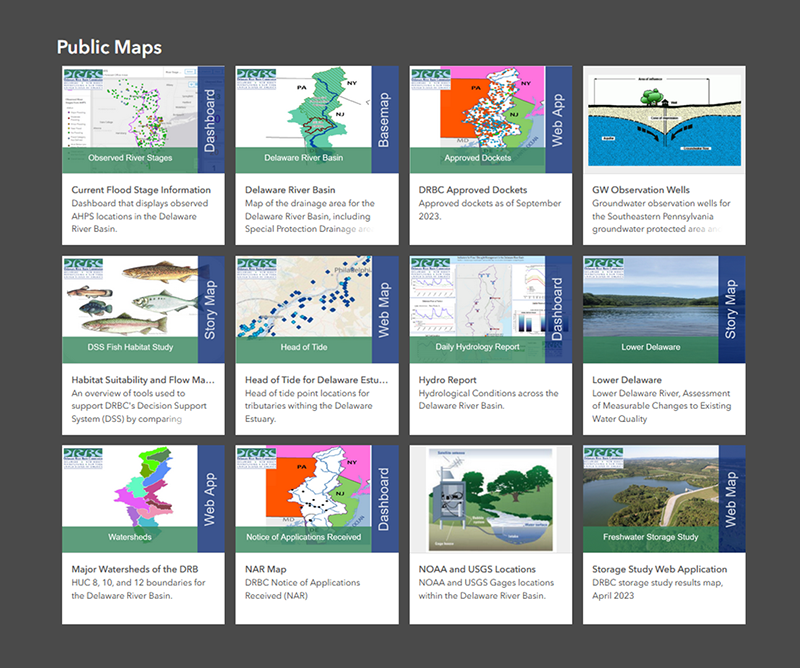
DRBC's ArcGIS Gallery
(click image to view)
Hydrologic Conditions Across the Delaware River Basin
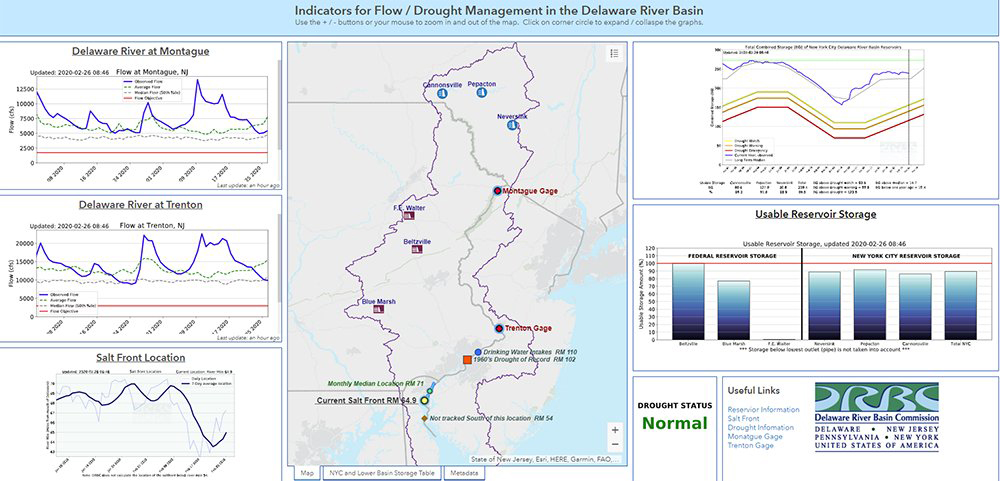 |
This ArcGIS dashboard of hydrologic data (click image to view) for the Delaware River Basin is updated daily every morning.
It is designed to give users an overview of various hydrologic conditions - flow at Montague, N.J. and Trenton, N.J., reservoir storage and salt front location - all in one place.
Please note that the conditions on this dashboard are only updated once daily and are not to be used for real-time observations.
• Additional DRBC hydrologic reports
• USGS Delaware River Dashboard
Map of DRBC Docket and Permit Holders
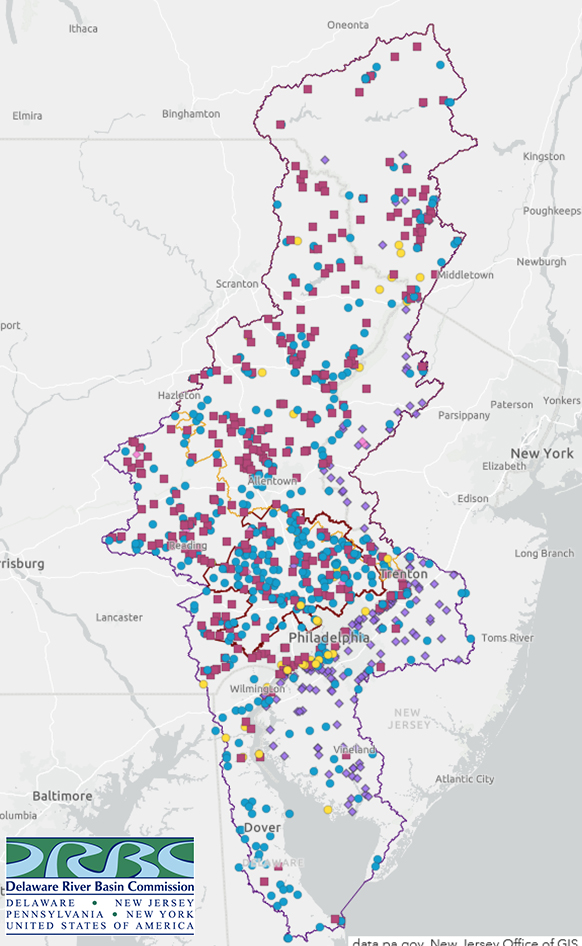 |
This map (click on the image to view) shows the location of projects having a current approval from DRBC or those currently engaged in the renewal or one process/opne permit process.
A single location is used for each project regardless of how many specific withdrawal or discharge locations the project may have.
• Learn more about DRBC's project review program
When you select a project, a pop-up menu will provide you with a list of key attributes and a link to a pdf file of the DRBC approval.
Please note that only projects approved since 1/1/2005 are available for display on the map.
The map is currently updated to include projects approved at the March 6, 2024, DRBC Business Meeting.
Lower Delaware River SPW Water Quality Assessment Story Map
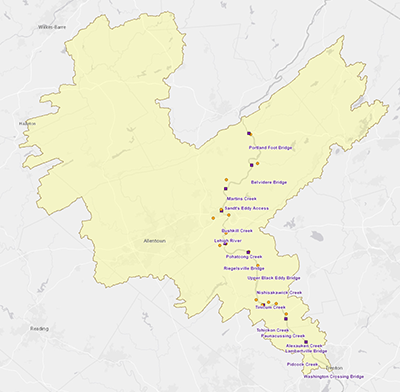 |
This story map (click on the image to view) accompanies DRBC's August 2016 report entitled Lower Delaware River Special Protection Waters Assessment of Measurable Changes to Existing Water Quality, Round 1: Baseline EWQ (2000-2004) vs. Post-EWQ (2009-2011).
The report compares water quality data initially collected from 2000-2004 to the assessment period of 2009-2011 at 24 different monitoring sites, and this map allows you to view each site included in the assessment.
For more information on the 2016 report, please click here.