Delaware • New Jersey • Pennsylvania
New York • United States of America
|
Water Quality Indicator |
Status |
Present Condition |
Trend |
|
DO - Upper & Central Region |
Good |
Good water quality |
↔ |
|
DO - Tidal River & Bay |
Fair |
Some areas with low oxygen |
↔ |
|
Nutrients - Upper Region |
Good |
Cold, low nutrient waters |
↔ |
|
Nutrients - Central Region to Lehigh River |
Good |
Warm, low nutrient waters |
↔ |
|
Nutrients - Central Region below Lehigh River |
Fair |
Warm, elevated nutrient waters |
↔ |
|
Nutrients - Tidal River & Bay |
Fair |
Elevated nutrients might be linked to signs of problems |
↔ |
|
Metals - Tidal River & Bay |
Fair |
Copper being investigated; no problems with other metals |
↔ |
|
Toxics: PCBs - Tidal River & Bay |
Poor |
PCBs persist, but reductions evident |
↑ |
|
Pharmaceuticals & Personal Care Products (PPCPs) - Tidal River |
Fair |
Priority PPCPs identified; codeine & metformin found in higher than expected amounts |
↔ |
|
Toxics in Fish Tissue |
Poor |
6 chemicals exceeded screening values in some fish from the Delaware River |
↔ |
|
Fish Consumption Advisories |
Poor |
Advisories exist for mercury & PCBs in many water bodies |
↔ |
|
↑ Improving ↓ Worsening ↔ No Trend or Stable |
|||
- In 1950, the urban Delaware River was one of the most polluted stretches of river in the nation
- In 1967, dissolved oxygen (DO) was too low (<1 mg/L) to support fish survival, and DRBC started a program to improve water quality
- By 1990, with $1.5B invested in wastewater treatment, DO improved to meet or exceed the goal of 3.5 mg/L
- A 197 mile segment of the Delaware River above Trenton is part of DRBC's Special Protection Waters program - possibly the longest stretch of river in the nation under an anti-degradation policy
- Over 85,000 chemicals are commercially available in the US; most remain unstudied and unregulated
Governments set standards for basic uses and for the acceptable amount of substances of concern that are found in our waters. These safeguards protect human health and the overall well-being of our streams, rivers, lakes, and bays. Maintaining good quality water is not always easy. Temperature, salt content, and other natural conditions - even the kind of bedrock and soils - are specific to each stream or river, affect water chemistry, and also affect our ability to assess and manage conditions. Generally, when we say "clean" we want to know if the water is fishable and swimmable, that is, is it healthy for us and for the plants and animals that live in the water.
Did You Know? The presence of a substance is measured as the amount per unit volume of water. For example, DO is measured as the number of milligrams in a liter of water (mg/L). 1 mg = 1/1000 (one thousandth) of a gram
Dissolved oxygen (DO) is a crucial measurement of healthy streams.
Fish Need Oxygen Too
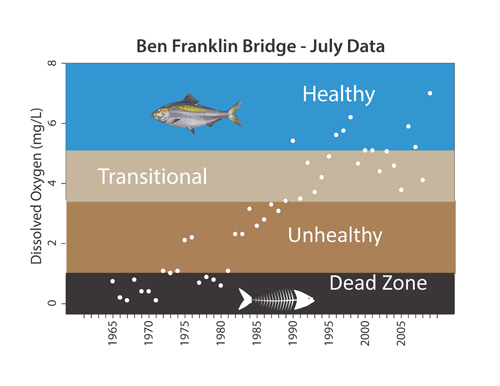
DO refers to the amount of oxygen gas in water. DO is essential for the breathing, growth, and reproduction of fish and shellfish. The amount of oxygen in water can typically range from 0 to 12 mg/L (saturation). Cold-water fish (like trout) require at least 6 mg/L to be healthy. At 4 to 5 mg/L, warm-water fish become stressed. Fish eggs and young fish need more oxygen than adults. A drop in DO to below 1 to 2 mg/L will result in a fish kill, where large amounts of fish die and float to the surface.
What Changes DO?
Warmer water generally contains less oxygen than colder water, so the amount of DO naturally changes seasonally and daily as water and air temperatures change. Salinity also affects DO; saltier water carries less oxygen than fresh water. Wastewater discharges, decaying leaves and seaweed, some chemical compounds, and too many nutrients can also decrease the amount of dissolved oxygen in water.
♦ Watch how DO can change with tide and time
DO Where Fresh Water Meets Salty
The history of DO recovery in the tidal Delaware River and Bay (aka the Estuary) is well known since automatic monitors track DO levels at 4 locations. Recent studies reveal an intriguing oxygen story for the estuary that is still unfolding. Increases in temperature and salinity - expected with sea level rise and global climate change - could lower the oxygen carrying capacity for portions of the Delaware River and Bay. It may be necessary to seek water quality improvements just to maintain the current, yet still highly changeable, levels of DO. Furthermore, current requirements may need revision to be protective of fish reproduction.
DO in Fresh Water
DO in the fresh water of the Delaware River above Trenton and in most tributaries appears to be generally good and reasonably stable. Adding more automatic monitors is recommended to improve our ability to measure and report on conditions. Many of the basin's best quality streams are located in the watersheds above Trenton, and the DRBC has a Special Protection Waters program in effect there to "keep the clean water clean."
High Water Quality
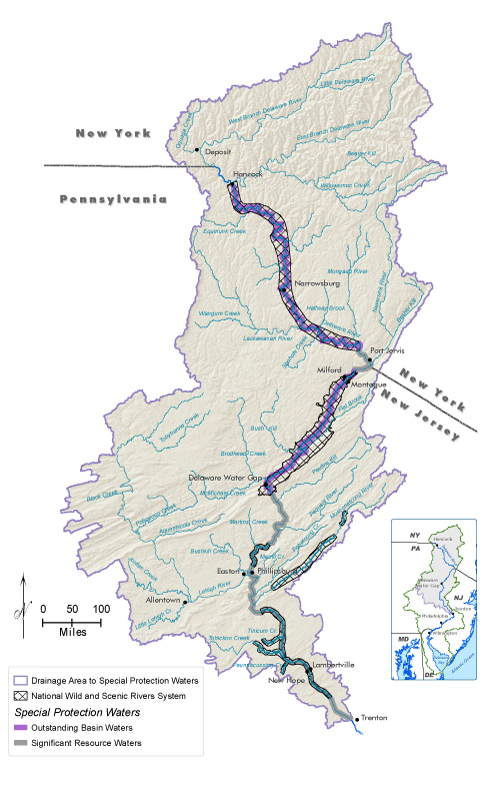
The mainstem of the Delaware River begins near Hancock, N.Y., and the cool, clean water flows 197 miles downstream to Trenton, N.J. This non-tidal portion (south of the geologic fall-line at Trenton, the river is subject to tidal influence) drains a landscape of nearly 6,800 square miles in three states, creating the political boundary between them. It is also the primary water supply for cities along its banks - most notably Easton, Pa., Trenton and Philadelphia. Water diverted through the Delaware and Raritan Canal regularly supplies water to 2.1 million people in northeastern New Jersey - and an additional 1.2 million in an emergency. Existing water quality in this stretch of river exceeds most state and federal standards, and to protect it, DRBC created the Special Protection Waters (SPW) program to "keep the clean water clean."
No Measurable Change
The objective of the SPW program is to ensure that the existing high quality waters are not measurably changed as a result of pollution inputs to the tributaries and the river. In partnership with the National Park Service, DRBC routinely collects data on water quality, plant, and macroinvertebrate conditions at 78 monitoring points. A new assessment of SPW water quality is in progress.
The data are also used in computer models developed for priority tributaries - that is, those that have a high number of existing discharges or are expected to have new growth and associated wastewater discharge needs. The models are used to predict possible changes to water quality and to establish discharge limits to prevent a measurable change.
Exceptional
The SPW designation is believed to establish the longest stretch of river in the nation under an anti-degradation policy. It also is a crucial function of the DRBC, a single agency established to cooperatively protect the water quality of a river shared by multiple states.
Nutrients promote growth in most plants. Forms of nitrogen (N) and phosphorus (P) are the most commonly measured and reported nutrients related to water quality. High levels of nutrients are not good, because they may reduce DO and can result in poor - or eutrophic - conditions in streams. Nitrogen and phosphorus pollution comes from fertilizers, animal waste, septic systems, storm runoff, and sewage treatment plants. Nitrogen and phosphorus pollution is reported to be a problem in more than half of the water bodies in the nation.
♦ Learn more about nutrients nationally
The Delaware Estuary is high in the amount of nutrients relative to other estuaries. There are signs of problems - including an area of persistent low DO in the urban river corridor - and nutrients have been identified as a potential cause. DRBC is working to identify appropriate levels of nutrients and sensible measures to take, especially in relation to DO.
♦ Learn more about the history of the Delaware Estuary's water quality (pdf 1.8 MB)
♦ Learn more about DRBC nutrient monitoring
What we drink and take for aches and pains also gets into our streams. Caffeine, aspirin, hormones, and antibiotics are just a few of the hundreds of pharmaceuticals (medicines) and personal care products - collectively referred to as PPCPs - that are used daily and flushed from homes, hospitals, and other facilities. Water treatment plants don't completely remove them, so they end up in streams and rivers. Water quality studies conducted by DRBC over a three year period identified priority PPCPs. Most were found in amounts similar to other urban areas. But, codeine and metformin - an oral anti-diabetic drug - were found in higher than expected amounts. The potential effects of these compounds is a concern; DRBC and Temple University will be doing more studies in 2013.

Certain chemicals tend to concentrate - or bioaccumulate - in fish in amounts thousands of times greater than the amount in the water itself. Eating these fish exposes the consumers - fish, birds, animals, and humans - to chemicals that may, over time, cause cancer or other harmful effects.
Mercury and PCBs are the most frequent reasons for state advisories to limit or avoid consumption of fish. Advisories exist on many streams, rivers, and lakes in the Delaware River Basin. Always check your state advisories before eating fish that you catch.
♦ Learn more about fish consumption advisories
Fish tissue samples from the Delaware River were checked for an additional 16 cancer-causing chemicals and 21 other toxic chemicals. Six of the cancer-causing substances were found to exceed screening values in some fish, indicating that additional work needs to be done to manage these chemicals. None of the toxic chemicals were found to exceed screening values.
♦ Learn more about fish contaminant levels (pdf 7.1 MB; TREB Ch. 3, pgs. 14-20 and 38-39)
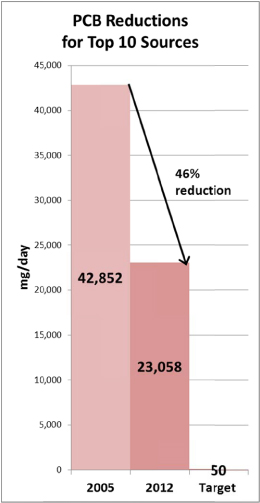
DRBC has dealt with polychlorinated biphenyls (PCBs) for over ten years. PCBs are a class of non-flammable and very stable compounds once used in a wide variety of ways - from transformers to house paint. The manufacture and use of PCBs was banned in 1976, but its stability means it has stuck around and is found nearly everywhere in soils and water. Efforts have been underway since 2000 to clean it up. It is a slow process, but necessary because PCBs can cause cancer and very serious health effects. In addition to checking water, soil, and fish for PCBs, DRBC requires Pollution Minimization Plans (PMPs) to reduce or eliminate PCBs where they are known to exist. Recent reports show that the plans required by DRBC are working. The top ten dischargers responsible for 90% of the point-source PCB loading have reduced their contributions by 46% since 2005. This improvement hopefully will show up as reduced amounts of PCBs in fish tissue in future years.
♦ Learn more about PCBs
♦ Learn more about how PMPs are working (pdf 2.7 MB)