 |
|
 |
||||||
|
||||||||
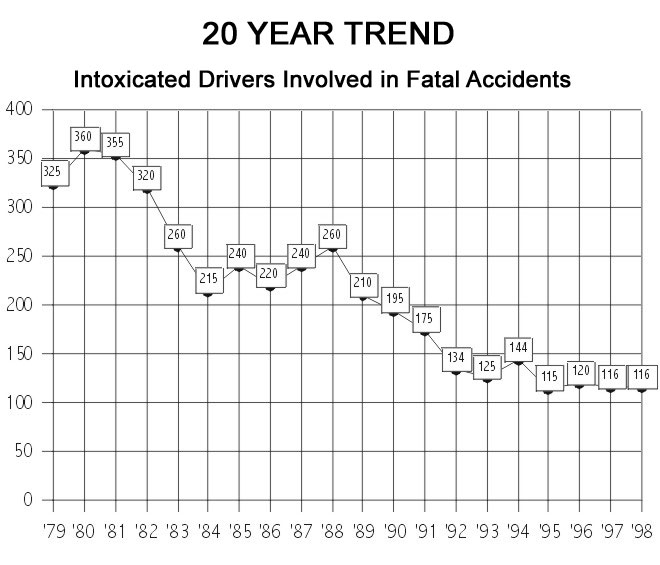
Alcohol Factors |
NOTE: Four surviving drivers tested positive for
drugs and two surviving drivers were listed as "Had been
drinking." EVALUATION: 1998 showed slight decrease in alcohol-related fatalities, continuing the downward trend. The number of fatal accident victims with blood alcohol readings above .10% decreased from 126 in 1997 to 110 in 1998, a decrease of 12.6%. Deceased drivers showed a slight decrease when compared to 1997. Of those drivers tested in each category, deceased drivers showed a decrease of 7.7% and surviving drivers showed an increase of 15.3% in the .10% and over category.
|
|||||||||||||||||||||||||||||||||||||||||||||||||||||||||||||||||||||||||||||||||||||||||||||||||||||||||||||||||||||||||||||||||||||||||||||||||||||||||||||||||||||||||||||||||||||||||||||||||||||||||||||||||||||||||||||||||||||||||||||||||||||||||||||||||||||||||||||||||||||||||||||||||||||||||||||||||||||||||||||||||||||||||||||||||||||||||||||||||||||||||||||||||||||||||||||||||||||||||||||||||
|
|
.01% - .04% |
.05% - .09% |
.10% - .14% |
.15% & Over |
Had been drinking |
Negative |
Not tested |
TOTAL |
|
Drivers |
18 |
6 |
17 |
54 |
1 |
222 |
60 |
378 |
|
Passengers |
5 |
7 |
2 |
10 |
1 |
70 |
64 |
159 |
|
Pedestrians |
7 |
4 |
6 |
19 |
1 |
85 |
30 |
152 |
|
Pedalcyclists |
1 |
1 |
0 |
2 |
0 |
9 |
5 |
18 |
|
TOTAL |
31 |
18 |
25 |
85 |
3 |
386 |
159 |
707 |
LEGEND: Had been drinking: includes those delayed deaths where an odor of alcohol was detected. Includes admittance of victim (in delayed death) or statements of witnesses. Includes lab reports which show a trace and not a percentage, or reading below 0.01%.
NEGATIVE: Tested and found to be negative.
NO TEST: Because of delayed death, age factor, contamination of samples, and the failure on the part of some investigative agencies and medical examiners to cause a test to be performed on victims.
NOTE: Twenty-five drivers, four passengers, four pedestrians and one pedalcyclist tested positive for drugs