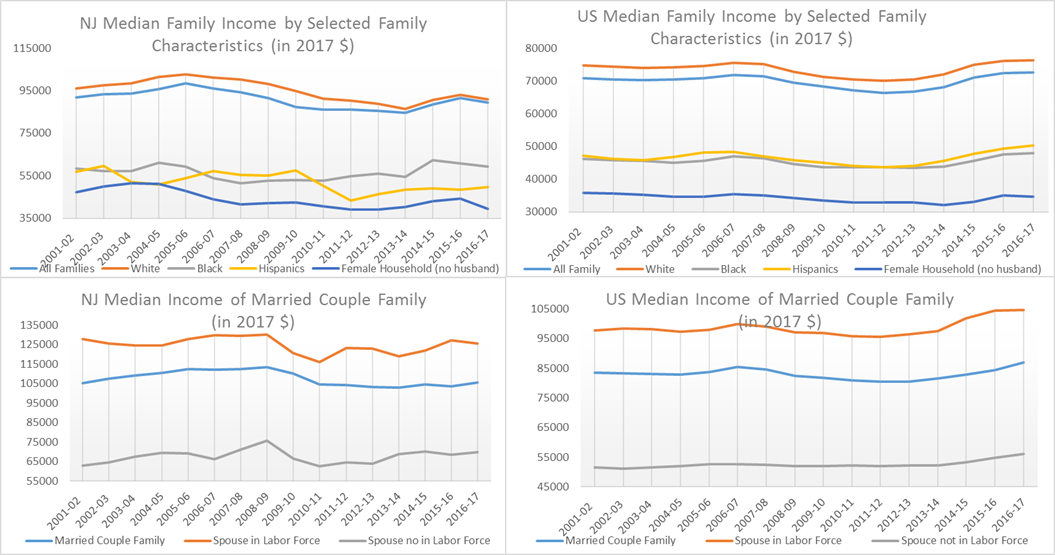
| Table 7. Median Family Income by Selected Family Characteristics | |||||||||||||||||
| New Jersey and United States: 2001 to 2017 (in 2017 dollars) | |||||||||||||||||
| Two-year Moving Average | 2001-02 | 2002-03 | 2003-04 | 2004-05 | 2005-06 | 2006-07 | 2007-08 | 2008-09 | 2009-10 | 2010-11 | 2011-12 | 2012-13 | 2013-14 | 2014-15 | 2015-16 | 2016-17 | |
| New Jersey | |||||||||||||||||
| ALL FAMILIES | $91,778 | $93,447 | $93,564 | $95,879 | $98,474 | $95,945 | $94,361 | $91,689 | $87,412 | $86,270 | $86,034 | $85,425 | $84,656 | $88,471 | $91,563 | $89,368 | |
| RACE of HOUSEHOLDER | |||||||||||||||||
| White | $ 96,180 | $ 97,536 | $ 98,604 | $ 101,417 | $ 102,789 | $ 101,116 | $ 100,393 | $ 98,103 | $ 94,788 | $ 91,390 | $ 90,441 | $ 88,766 | $ 86,566 | $ 90,693 | $ 93,102 | $ 90,878 | |
| Black | $ 58,482 | $ 57,275 | $ 57,276 | $ 61,203 | $ 59,165 | $ 53,983 | $ 51,579 | $ 52,595 | $ 53,020 | $ 52,608 | $ 54,673 | $ 55,842 | $ 54,552 | $ 62,231 | $ 60,919 | $ 59,220 | |
| Hispanic origin | $ 56,976 | $ 59,607 | $ 52,088 | $ 50,969 | $ 53,996 | $ 57,125 | $ 55,514 | $ 55,223 | $ 57,400 | $ 50,187 | $ 43,342 | $ 46,290 | $ 48,557 | $ 49,136 | $ 48,527 | $ 49,605 | |
| TYPE OF FAMILY | |||||||||||||||||
| Married Couple Family | $105,101 | $107,584 | $109,232 | $ 110,507 | $ 112,447 | $ 112,192 | $ 112,333 | $ 113,408 | $ 110,095 | $ 104,439 | $104,147 | $ 103,265 | $ 102,921 | $ 104,621 | $ 103,400 | $105,501 | |
| Spouse in Labor Force | $127,798 | $125,488 | $124,400 | $ 124,633 | $ 127,705 | $ 129,596 | $ 129,526 | $ 130,158 | $ 120,701 | $ 115,841 | $123,122 | $ 123,016 | $ 118,814 | $ 121,720 | $ 127,051 | $125,477 | |
| Spouse not in Labor Force | $ 62,804 | $ 64,367 | $ 67,396 | $ 69,346 | $ 69,166 | $ 66,013 | $ 70,980 | $ 75,567 | $ 66,554 | $ 62,581 | $ 64,377 | $ 63,683 | $ 68,836 | $ 70,050 | $ 68,533 | $ 69,879 | |
| Female Householder Family | |||||||||||||||||
| (no husband) | $ 47,237 | $ 49,932 | $ 51,572 | $ 51,057 | $ 47,813 | $ 43,949 | $ 41,472 | $ 42,206 | $ 42,354 | $ 40,515 | $ 39,237 | $ 39,178 | $ 40,401 | $ 43,129 | $ 44,334 | $ 39,392 | |
| United States | |||||||||||||||||
| ALL FAMILIES | $ 70,878 | $ 70,387 | $ 70,297 | $ 70,473 | $ 70,901 | $ 71,889 | $ 71,383 | $ 69,445 | $ 68,325 | $ 67,167 | $ 66,447 | $ 66,796 | $ 68,062 | $ 71,066 | $ 72,431 | $ 72,582 | |
| RACE of HOUSEHOLDER | |||||||||||||||||
| White | $ 74,793 | $ 74,475 | $ 74,084 | $ 74,204 | $ 74,650 | $ 75,480 | $ 75,210 | $ 72,856 | $ 71,305 | $ 70,415 | $ 70,082 | $ 70,542 | $ 71,937 | $ 74,982 | $ 76,088 | $ 76,303 | |
| Black | $ 46,148 | $ 45,771 | $ 45,710 | $ 45,068 | $ 45,543 | $ 47,020 | $ 46,425 | $ 44,662 | $ 43,619 | $ 43,711 | $ 43,741 | $ 43,555 | $ 43,901 | $ 45,696 | $ 47,615 | $ 47,985 | |
| Hispanic origin | $ 47,172 | $ 46,148 | $ 45,839 | $ 46,777 | $ 48,122 | $ 48,305 | $ 47,014 | $ 45,766 | $ 44,969 | $ 44,072 | $ 43,595 | $ 44,000 | $ 45,543 | $ 47,780 | $ 49,301 | $ 50,400 | |
| TYPE OF FAMILY | |||||||||||||||||
| Married Couple Family | $ 83,573 | $ 83,290 | $ 82,982 | $ 82,822 | $ 83,758 | $ 85,398 | $ 84,540 | $ 82,482 | $ 81,706 | $ 80,903 | $ 80,522 | $ 80,494 | $ 81,589 | $ 82,788 | $ 84,422 | $ 86,892 | |
| Spouse in Labor Force | $ 97,885 | $ 98,418 | $ 98,255 | $ 97,353 | $ 97,955 | $ 99,918 | $ 99,009 | $ 97,100 | $ 96,919 | $ 95,891 | $ 95,627 | $ 96,515 | $ 97,540 | $ 101,935 | $ 104,557 | $104,681 | |
| Spouse not in Labor Force | $ 51,531 | $ 51,177 | $ 51,483 | $ 52,014 | $ 52,534 | $ 52,513 | $ 52,503 | $ 52,003 | $ 51,895 | $ 52,114 | $ 51,903 | $ 52,121 | $ 52,088 | $ 53,279 | $ 54,749 | $ 56,001 | |
| Female Householder Family | |||||||||||||||||
| (No Spouse) | $ 35,852 | $ 35,721 | $ 35,219 | $ 34,628 | $ 34,687 | $ 35,504 | $ 35,109 | $ 34,245 | $ 33,496 | $ 32,936 | $ 32,893 | $ 32,923 | $ 32,065 | $ 33,176 | $ 35,079 | $ 34,738 | |
| Note: The New Jersey income figures were inflated by the average of New York-metro and | |||||||||||||||||
| Philadelphia-metro Consumer Price Indexes for all Urban Consumers (CPI-U). | |||||||||||||||||
| The US figures were inflated by the national CPI-U. | |||||||||||||||||
| Source: US Bureau of the Census, Current Population Survey (CPS): March 2001 through 2018. | |||||||||||||||||
| Prepared by : NJ Dept of Labor & Workforce Dev., Div. of Economic & Demographic Research, 10/2018. | |||||||||||||||||
|
|||||||||||||||||