Delaware • New Jersey • Pennsylvania
New York • United States of America
- DRBC Publishes Microplastics Report
- What are Microplastics?
- DRBC Microplastics Study
- Other Microplastics Studies in the DRB
- Related Links
Read the Report!
- Reducing Microplastics in the Delaware River Estuary (pdf; August 2022)
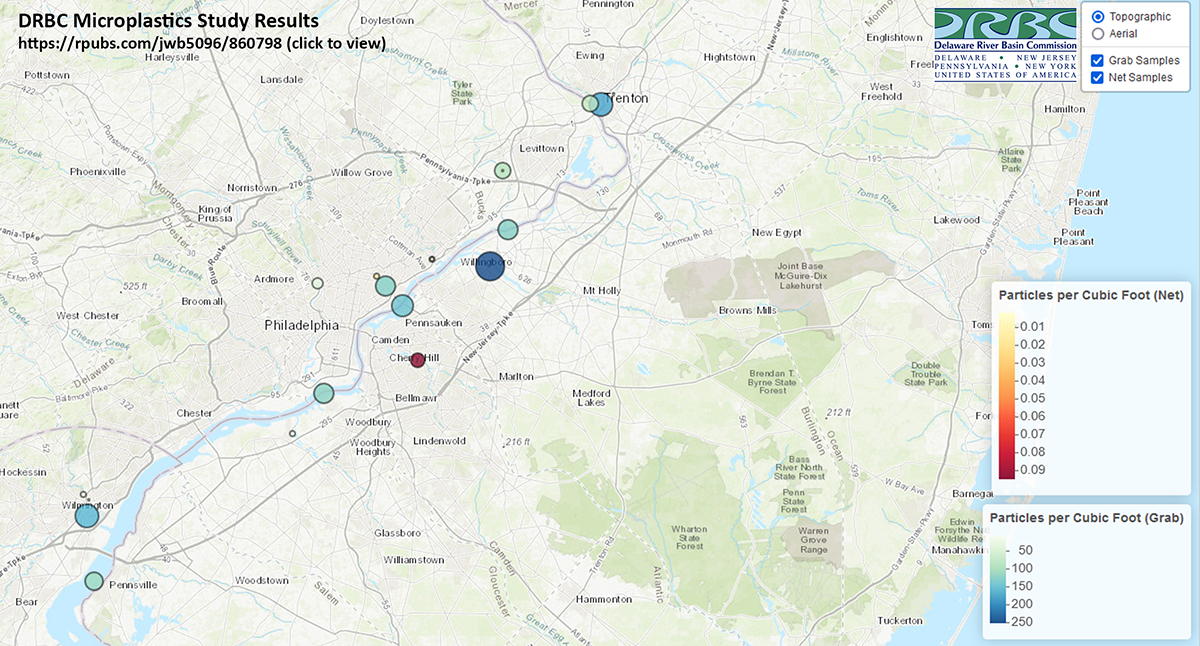
Study Results (click to view)
View larger (jpg)
News Release & Media Coverage
- Microplastics pervasive in waters adjacent to Delaware River’s population centers (issued August 30, 2022)
- In September 2022, the DRBC's Jake Bransky was interviewed on WHYY's Radio Times (September 12, 2022)
More Information
Plastic is perhaps the most prevalent and persistent type of debris found in our oceans, rivers and large lakes.
Definition of Microplastics
- Plastic pollution is found in all shapes and sizes, but plastic debris less than five millimeters in length (or about the size of a sesame seed) is known as "microplastics."
- These tiny particles easily pass through water filtration systems and end up in receiving waters.
- How microplastics impact human health and aquatic life is still unknown.
Sources of Microplastics
Over time, larger plastics degrade into microplastics, but microplastics also include originally manufactured products such as the following:
• Microbeads, found in cosmetics and personal care products (such as toothpaste);
• Industrial scrubbers used for abrasive blast cleaning;
• Microfibers, generated from washing synthetic clothing made of polyester and nylon; and
• Resin pellets used in the plastic manufacturing process.
 |
| View larger (jpg) |
In 2018, the DRBC received a grant from the Delaware Watershed Conservation Fund to monitor for microplastics and model loadings of microplastics in the upper Delaware River Estuary from Trenton, N.J. to the C & D Canal.
Samples were collected in spring and fall 2019, with additional samples collected in 2020 and 2021.
Other sections of the Delaware River have been studied, but not this highly urbanized section, which is likely a major contributor to microplastics found in the estuary and bay.
Study Goals
• To better understand the nature and distribution of microplastics in this portion of the Delaware River Estuary.
• To increase public awareness of microplastics and support cleanups to reduce plastics loadings.
This study will lay the groundwork for future microplastics monitoring and cleanup efforts in the Basin and beyond.
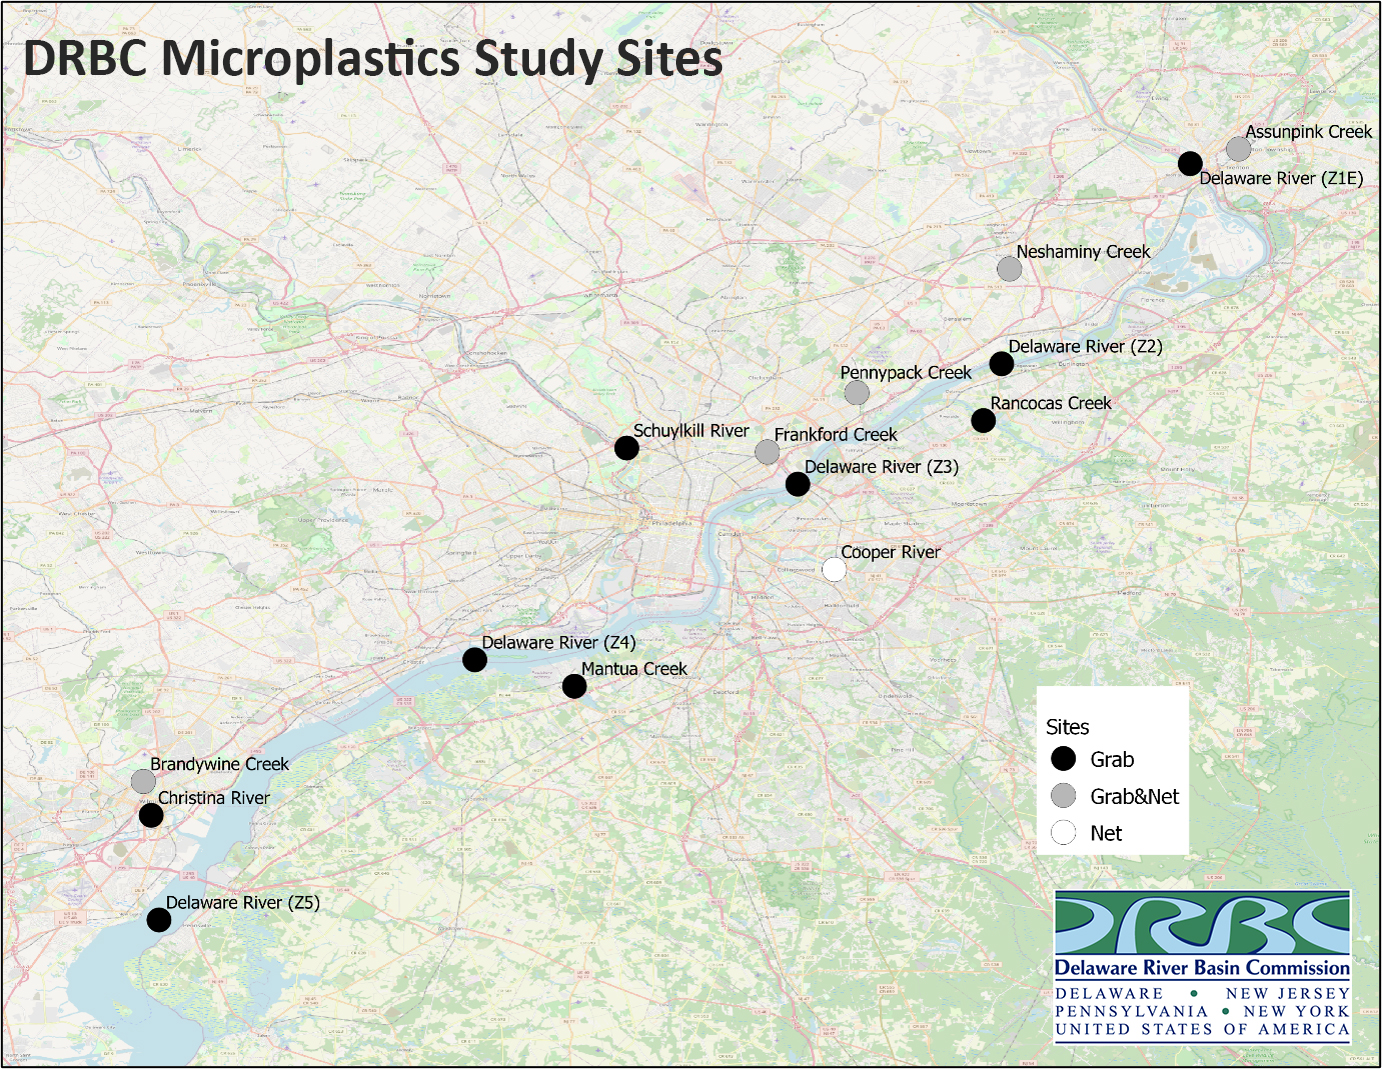
Sites Sampled: 15
• Four Delaware River Estuary sites (one site in each DRBC Water Quality Zone 2-5)
• Ten tidal Delaware River tributaries: Four in Pa., four in N.J. & two in Del.
• Delaware River at Trenton, N.J. (captured the largest loading to the estuary, the non-tidal Delaware River)
Sampling Methods & Analysis
Samples were collected via net, grab sample or Niskin sampler.
- Net samples were collected on six tributaries.
- Grab samples were collected by bridge on nine tributaries (not the Cooper River) and the Delaware River at Trenton.
- A Niskin sampler was used to collect samples from the Delaware River Estuary by boat.
Samples were analyzed by Temple University for microplastic concentrations.
- To determine concentrations, samples were filtered and sediment and organic matter removed.
- Microplastics found in the samples are then analyzed using Fourier transform infrared spectroscopy.
- Shape, color, size and composition of the microplastics found were determined.
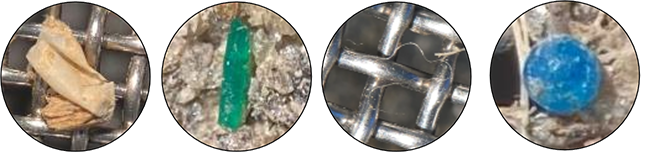
Images of various shapes of microplastic particles found in DRBC samples
Modeling Microplastics
- DRBC used its existing 3D Hydrodynamic Model to look at how microplastics are transported in the Delaware River Estuary: where microplastics could travel to and concentrations from key tributary sources.
- Simulated low & high flow conditions. Higher flows corresponded to faster travel times and a larger footprint.
Study Results
- Microplastics were found in each sample, including blanks.
- Most common: polyester, rayon & cellulosic fibers. A variety of shapes, colors, sizes and types were seen.
- Grab samples showed higher concentrations than net samples; potential reason is that smaller particles could get through net.
Study Final Report & Data Mapper: August 2022
- Reducing Microplastics in the Delaware River Estuary (pdf)
- Link to Data Mapper
- News Release (issued August 30, 2022)
Presentations & Poster
- Monitoring and Reducing Microplastics in the Delaware River Estuary (pdf; presentation given August 2025)
- Reducing Microplastics in the Delaware River Estuary (pdf; poster presented at the 2023 Delaware Estuary Science and Environmental Summit)
- Delaware Estuary Microplastics Monitoring and Cleanup (pdf; presentation given January 2022)
- Delaware Estuary Microplastics Monitoring and Cleanup (pdf; presentation given May 2019)
Cleaning Up Plastic Pollution
In 2021, two cleanups were organized by DRBC staff in known plastic-pollution hotspots.
- Cleaning up large plastic debris prevents fish and wildlife from becoming entangled in objects like cords, fishing line, nets and beverage containers.
- On a finer scale, removing these debris before they have a chance to break down will reduce the presence of microplastics and lower the risk of other harmful chemicals entering the Basin’s waters.
- Better understanding which source tributaries are introducing the most microplastics will help target future cleanup efforts.
Study Photos
 |
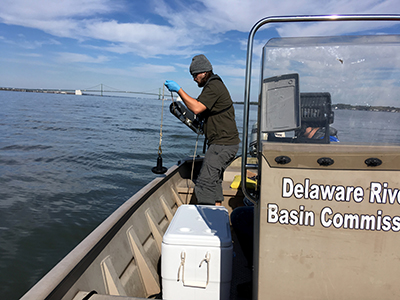 |
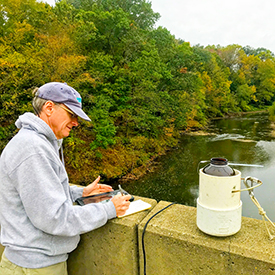
| Plastic pollution along Philadelphia's Frankford Creek. This is one of the tributary monitoring sites in DRBC's study. Photo by the DRBC. | DRBC staff use a Niskin sampler to collect a water sample from the Delaware Estuary to monitor for microplastics. Photo by the DRBC. |
 |
 |
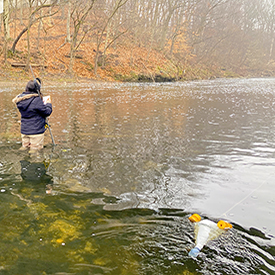 |
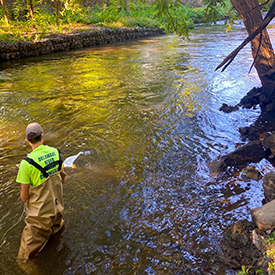
| DRBC staff uses a net to collect a sample from the Assunpink Creek to monitor for microplastics. Photo by the DRBC. | DRBC staff collects a grab sample from the Neshaminy Creek to monitor for microplastics. Photo by the DRBC. | DRBC staff measures flow and uses a net to collect a sample from the Neshaminy Creek to monitor for microplastics. Photo by the DRBC. |
 |
| As seen under the microscope: microplastics collected from the Delaware Bay by University of Delaware researchers. Photo courtesy of the University of Delaware. |
• United States Geological Survey and the National Park Service
• Philadelphia Water Department
• U.S. EPA
- Observations and Simulations of Microplastic Debris in a Tide-Wind-Freshwater Driven Estuarine Environment: the Delaware Bay (pdf 3.75 MB; Jonathan H. Cohen et. al, Environ. Sci. Technol. 2019, 53, 14204-14211)
- USGS: Microplastics in Our Nation's Waterways
- NOAA Marine Debris Program
- NOAA National Ocean Service: What are Microplastics?
- Society of Environmental Toxicology and Chemistry (SETAC): Plastics Pollution - A Breakdown
- University of Delaware Under the Scope: Microplastics
- Scientific American: Microplastics 3-Part Series (parts 2 & 3 linked from bottom of this article)
- National Geographic: Planet or Plastic?