 Official Site of The State of New Jersey
Calculating the Rating
One-Star LTC Selection Methodology
The Office of the State Comptroller (OSC) selected the LTCs with the lowest (one star) CMS Care Compare (CC) Overall Rating for first month of each quarter for at least six of the past eight quarters (2021 and 2020). CMS calculates Overall Ratings based on scores in three categories:
Health Inspections: This score is based on deficiencies found in the 3 most recent health inspections and in any complaint, incident or infection control investigations over the last 3 years. Inspections and investigations are performed by the New Jersey Department of Health, the state’s survey agency. Ratings are calculated when an inspection occurs and/or when an investigation results in a deficiency.
Quality Measures: CMS utilizes clinical and claims data reported by the nursing homes to develop quality measures. Ratings are calculated quarterly based on performance in each quality measure.
Staffing: This score is based on the number of nursing staff hours per resident per day, as evidenced by payroll data submitted by nursing homes. This score is also calculated quarterly.
You can visit the CMS Nursing Home Compare Technical Details and Technical Users’ Guide for more information on the CMS rating process.
One-Star LTCs That Receive Payments From NJ Medicaid
With a few exceptions, the facilities on our list have consistently been rated one star over the last three years. Some experienced fast and dramatic declines, and have remained low quality for at least several years.
The 15 one-star LTCs on OSC's list have been rated one-star for at least six out of the eight previous quarters.
| Provider Name | October 2021 Overall Rating | July 2021 Overall Rating | April 2021 Overall Rating |
January 2021 Overall Rating | October 2020 Overall Rating | July 2020 Overall Rating | April 2020 Overall Rating | January 2020 Overall Rating |
|---|---|---|---|---|---|---|---|---|
| CARE ONE AT EVESHAM | 1 | 1 | 1 | 1 | 1 | 2 | 1 | 1 |
| CEDAR GROVE RESPIRATORY AND NURSING CENTER | 1 | 1 | 1 | 1 | 1 | 1 | 1 | 1 |
| COMPLETE CARE AT WILLOW CREEK | 2 | 1 | 1 | 1 | 1 | 1 | 1 | 2 |
| CRANFORD PARK REHABILITATION & HEALTHCARE CENTER | 1 | 1 | 1 | 1 | 1 | 1 | 1 | 1 |
| FOREST MANOR HCC | 1 | 1 | 1 | 1 | 1 | 1 | 1 | 1 |
| LAKEVIEW REHABILITATION AND CARE CENTER | 2 | 1 | 1 | 1 | 1 | 1 | 1 | 1 |
| NEW GROVE MANOR | 1 | 1 | 1 | 1 | 1 | 1 | 0 | 0 |
| OCEANA REHABILITATION AND NC | 1 | 1 | 1 | 1 | 1 | 1 | 1 | 1 |
| PALACE REHABILITATION AND CARE CENTER, THE | 1 | 1 | 1 | 2 | 1 | 1 | 1 | 1 |
| RIVERVIEW ESTATES | 1 | 1 | 2 | 1 | 1 | 1 | 1 | 2 |
| SILVER HEALTHCARE CENTER | 1 | 1 | 1 | 1 | 1 | 1 | 1 | 1 |
| SOUTH JERSEY EXTENDED CARE | 1 | 1 | 1 | 1 | 1 | 1 | 1 | 1 |
| STERLING MANOR | 1 | 1 | 1 | 1 | 1 | 1 | 1 | 1 |
| WARDELL GARDENS AT TINTON FALLS | 2 | 1 | 1 | 1 | 1 | 1 | 1 | 1 |
| WOODLAND BEHAVIORAL AND NURSING CENTER | 1 | 1 | 1 | 1 | 1 | 1 | 1 | 1 |
Source: CMS NHC Provider and Ownership Datasets
*LTC received an Overall Rating of zero (0) while in the CMS Special Focus Facility Program.
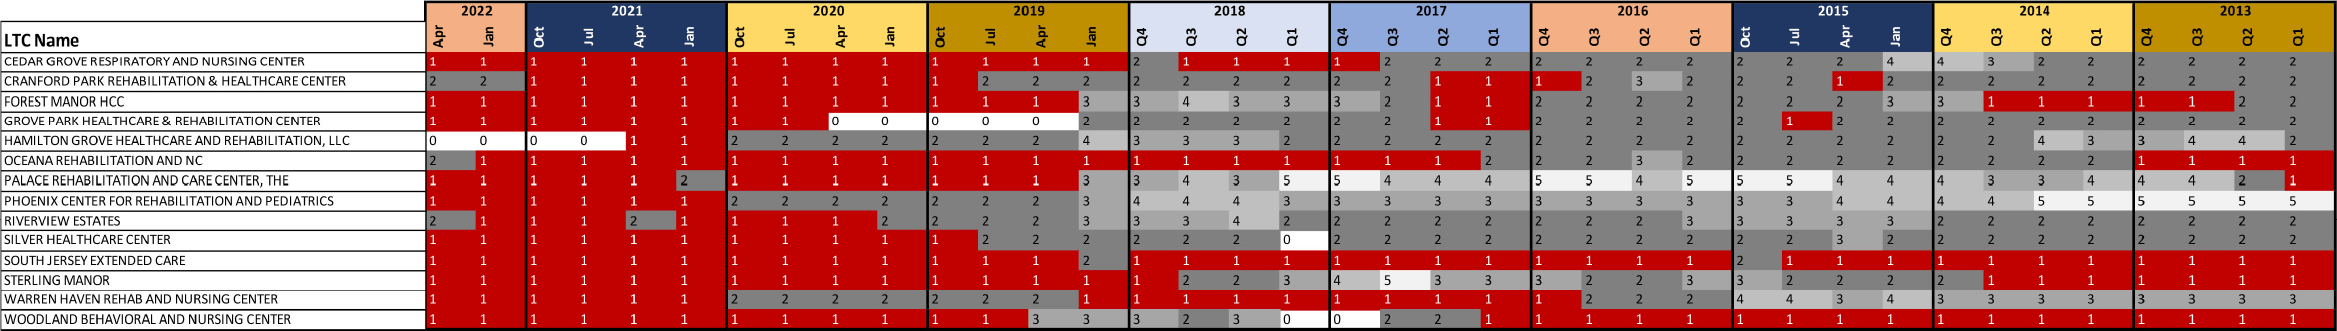
Historical Ratings
Historical Ratings Chart
Statistics
The average Overall Rating for New Jersey Medicaid LTCs is 3.6 (5 being the highest), which is slightly better than the national average of 3.1.
The facilities on this list have a combined total of 2,650 certified beds with a combined average of 1,850 residents per day. See how their average number of residents compare.
During State Fiscal Year 2022, the facilities on this list received an average of $1.97 per resident per day in quality incentive payments from the New Jersey Medicaid Program. The average incentive payment for all New Jersey LTCs is $2.55 per resident per day. See how their incentive payments compare and learn more about the New Jersey Medicaid Quality Incentive Payment Program (QIPP).
New Jersey Medicaid paid about $1.74 billion to LTCs in state fiscal year 2021. The worst performing facilities received about $105 million in New Jersey Medicaid payments in state fiscal year 2019, accounting for about 6% of New Jersey Medicaid payments to LTCs. See how their payments compare.
More Details on OSC's Methodology
- MFD obtained data from the January, April, July, and October 2021 and 2020 Care Compare Provider datasets. Data from the first month of each quarter dating back to 2013 was also obtained. The provider dataset includes the facilities’ Overall Rating, location, Medicaid participation status, ownership type, number of certified beds and average number of residents.
- MFD also utilized the Care Compare Ownership dataset from October 2021, which includes data on the legal business name, owner name and owner role.
- MFD filtered the data to include:
- only New Jersey LTCs with Medicaid beneficiaries;
- first month of each quarter for at least six of the past eight quarters; and
- overall Ratings for each quarter dating back to January 2013 for reference; these ratings were not used in the selection process.
- New Jersey Medicaid payment data from state fiscal years 2017, 2018, and 2019 was downloaded from the New Jersey Medicaid System/ Shared Data Warehouse. Medicaid claims payment data for both Fee for Service and Managed Care Organizations were combined for the total payment amounts. These numbers are estimates and do not account for future claim edits and/or retractions.
- Links to each individual facility’s CC page and New Jersey Department of Health page were also utilized.
Back
to top