Delaware • New Jersey • Pennsylvania
New York • United States of America
Introduction
In our changing Basin, looking to the past to design for extreme rainfall events is no longer a best practice. Flood analyses and stormwater infrastructure design have generally assumed that conditions will not change in the future, basing calculations on historical data that may now be outdated by years or even decades.
However, current data show that extreme rainfall events are increasing throughout the Delaware River Basin, and these more extreme events exacerbate existing flooding and challenge stormwater management. This underscores the immediate need for a tool that looks at how future rainfall patterns may change.
The Projecting Extreme Precipitation in the Delaware River Basin tool released by the DRBC allows users to obtain estimates of future changes in intensity, duration and frequency (IDF) curves throughout the Delaware River Basin. The curves project future rainfall patterns based on regional models and can be plotted against historical data (Atlas 14) to compare outcomes, helping inform stormwater management and infrastructure design to increase water resilience.
- View News Release Announcing the Tool's Availability (issued March 20, 2024)
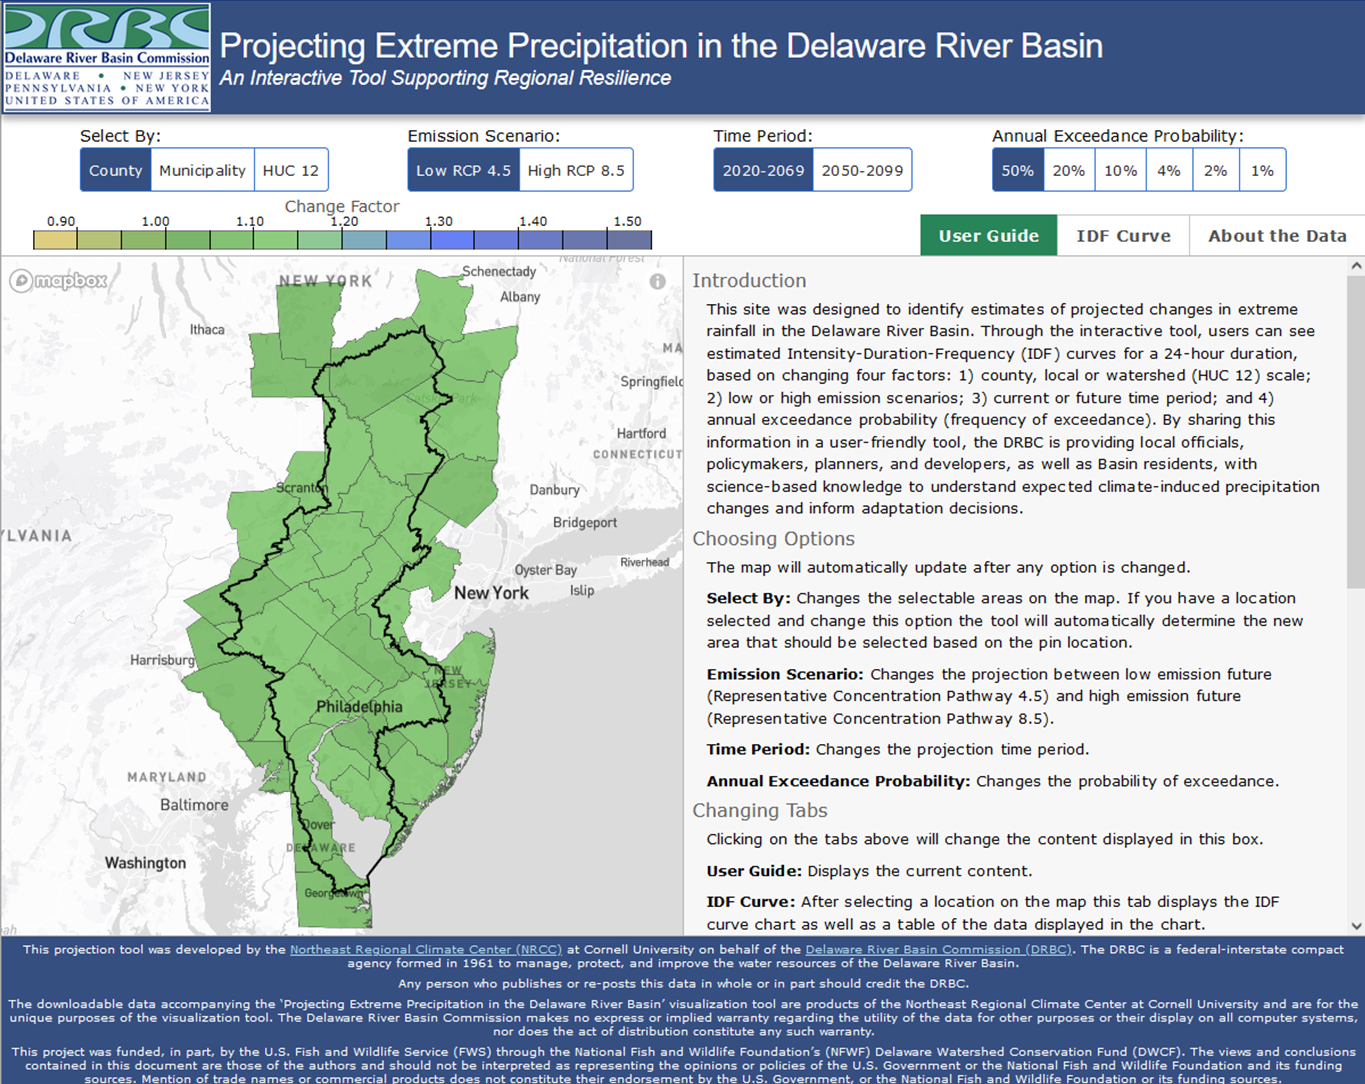 |
| Click the image to use the tool. |
Use of the Tool
Based upon trusted, localized information, the tool was designed to give engineers, planners and decisionmakers in our region the science-based information they need to better understand future conditions and help them unlock mitigation and adaptation possibilities.
Users can see how storm events may intensify in the future by:
- Location: county, municipality or HUC 12 (watershed-scale)
- Global Emissions Scenario: low or high
- Time Period of Interest: 2020-2069 (current-near future) or 2050-2099 (future)
- Annual Exceedance Probability*: select either 50%; 20%; 10%; 4%; 2% or 1%
*What once was referred to as an "x-year storm" is now an "annual exceedance probability." For example, a 100-year storm has a 1% annual exceedance probability; a 50-year storm = 2%; a 25-year storm = 4%; a 10-year storm = 10%; a 5-year storm = 20%; and a 2-year storm has a 50% annual exceedance probability.
IDF Tool
The IDF Tool Webpage includes a user guide and detailed information about how the data were derived.
Here are some additional resources:
NJDEP Extreme Precipitation Tool
The projection tool developed for the Delaware River Basin is based upon the same methods used by the Northeast Regional Climate Center in studies conducted in partnership with the New Jersey Department of Environmental Protection (NJDEP).
This project was funded, in part, by the U.S. Fish and Wildlife Service (FWS) through the National Fish and Wildlife Foundation’s (NFWF) Delaware Watershed Conservation Fund (DWCF).
The views and conclusions contained in this document are those of the authors and should not be interpreted as representing the opinions or policies of the U.S. Government or the National Fish and Wildlife Foundation and its funding sources. Mention of trade names or commercial products does not constitute their endorsement by the U.S. Government, or the National Fish and Wildlife Foundation or its funding sources.